Wars stimulate economic activity by increasing the demand for goods and services needed by the military. Increased demand for weapons systems, munitions, uniforms, and vehicles spurs an increase in manufacturing. However, wars also entail opportunity costs: by mobilizing military personnel and stimulating war-related activity, we forgo opportunities to stimulate other types of economic activities, such as manufacturing clean energy or expanding access to education. In this paper I examine the opportunity costs of war. Specifically, I present estimates of lost employment opportunities: the difference between the number of jobs created by US federal spending on wars since 2001 and the number of jobs that could have been created through other types of federal spending. I show that federal spending dedicated to fighting wars over the past 14 years has resulted in lost employment opportunities of between one and three million jobs.
As of July 2014, the tally of the costs of the wars in Iraq and Afghanistan since 2001 is $1.54 trillion and rising. If we use a more comprehensive estimate of war spending, including war-related spending and aid in Pakistan, spending for Operation Noble Eagle, [1] and war-related increases to the Pentagon base budget and Homeland Security, the total spent rises to $2.9 trillion for the 2001-2014 period. [2]
In a 2011 paper I co-wrote with Robert Pollin, “The US Employment Effects of Military and Domestic Spending Priorities,” we estimate the number of jobs created through various areas of federal spending.[3] Using an input-output model, we estimate the economy-wide employment impacts of various types of government spending, including on military, clean energy, health care, education, and tax cuts for personal consumption. The jobs included in these estimates include both public and private sector jobs, from military contractors and enlisted officers to solar panel installers, nurses and doctors, teachers, office managers and restaurant workers.
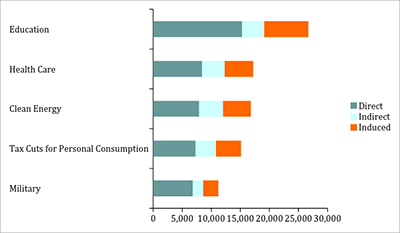
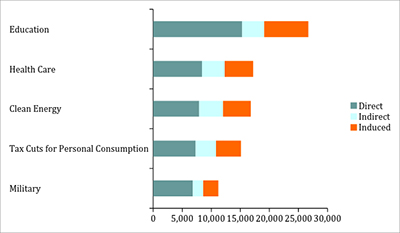
We find that for each $1 billion of federal spending, fewer jobs are created by spending on the military than on any other area in our study. While $1 billion creates 11,200 military-related jobs (direct, indirect, and induced, described below), the same level of spending creates 15,100 jobs through tax cuts for personal consumption, 16,800 jobs in clean energy, 17,200 jobs in health care, and 26,700 jobs in education. In other words, clean energy and health care spending create 50% more jobs than the equivalent amount of spending on the military. Education spending creates more than twice as many jobs.
 These estimates represent the economy-wide employment effects, meaning that we include the jobs created directly by the industry in question (e.g. military personnel or teachers), as well as jobs created through the supply chain, or “indirect” jobs (such as workers making uniforms for military personnel, or employees in the book publishing industry). We also include “induced” jobs, created by the consumption multiplier. As workers in the direct and indirect industries spend their paychecks, they create additional demand and employment in services such as grocery stores, clothing retailers, and doctors’ offices.
There are various reasons why military spending creates fewer jobs than the alternatives. These are:
- Labor intensity;
- Domestic content; and
- Compensation per worker.
Labor intensity measures how much of total spending goes to labor, rather than to equipment and facilities. In the case of education, a high percentage of total spending goes directly to teachers’ salaries. Military-related spending is more capital intensive, with less of the total spending going to workers, thus creating fewer jobs for the same amount of spending.
Domestic content is the proportion of total spending for goods and services produced in the US, versus spending abroad or spending on imports. Military workers spend more of their earnings abroad than do teachers or other workers in the domestic economy. Furthermore, a significant amount of spending by the Department of Defense goes to contractors working overseas. Between 2001 and 2013, an increasing percentage of military contracts were performed abroad. Using data from USASpending.gov, I find that while federal spending for military contracts performed in the US doubled from 2001 to 2013, it quadrupled for work performed outside the US Table 1 presents data summarized from USASpending.gov.
 (Source: USASpending.gov and author calculations [4])
In Table 1, we see that the vast majority of military contracts were performed in the US both in 2001 and 2013 (95% and 86%, respectively), yet there was also a significant increase in federal spending outside of the US, as military contracts performed abroad rose from about $5 billion in 2001 to nearly $30 billion in 2013. This $25 billion increase is a significant opportunity cost to the US economy. This is one example of how the second factor, domestic content, captures the difference in the percentage of spending that stays within the US versus that leaking out of the domestic economy. The spending abroad by military workers and the increase in defense contracts performed outside the US both contribute to lower employment multipliers for military spending in comparison to other types of federal spending.
The final factor that explains why spending on the military creates fewer jobs is compensation for workers in this field. If wages are lower in one industry than another, it is possible to employ a greater number of workers with the same amount of money. On average, compensation in military-related industries is slightly higher than compensation in other areas, thus creating fewer military-related jobs for a given amount of spending. The 2011 Pollin and Garrett-Peltier paper discusses these differences in compensation levels. We found that military wages were about 13-14 percent higher than wages in clean energy, health care, and education. The value of benefits was greater still in the military than in non-military industries. When we combine wages and benefits for a measure of total compensation, military compensation is 20-24 percent higher than clean energy, health care, or education compensation.
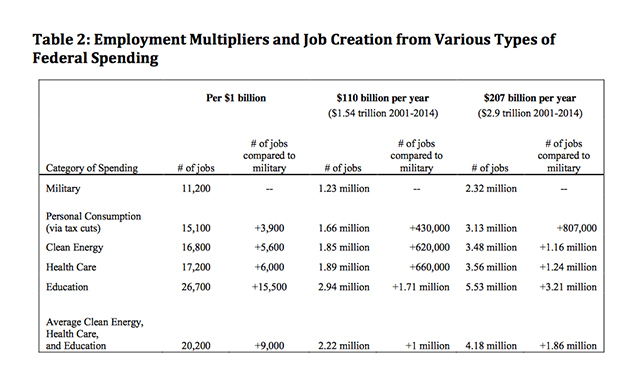
With these factors in mind, we look at the opportunity cost of expenditures on the wars in Afghanistan and Iraq, $1.54 trillion according to the narrow definition or $2.9 trillion according to the more comprehensive definition. Averaging the costs over 14 years (2001-2014), we then compare the employment effects of $110 billion or $207 billion per year in military and non-military expenditures. The results are presented in Table 2.

Comparing the two extremes, jobs created through military spending versus education spending, and using our broader measure of war spending, we see that we could have created 3.21 million more jobs per year through education than we did through war spending. If we instead take the average of clean energy, health care, and education spending, we find that federal spending could have created 2.2 million to 4.18 million jobs annually, as opposed to 1.23 to 2.32 million jobs created through military spending. Thus the “job opportunity cost of war” is between 1 and 1.86 million lost job opportunities per year. That is, if over the years 2001-2014 we had not been at war but instead had channeled our resources into expanding the clean energy industry, broadening health care coverage, and increasing educational opportunities, nearly two million more people would have been employed each year. In today’s economy, that could have reduced unemployment from 6.1 to 4.9 percent.[5]
In sum, Table 2 provides examples of the losses in employment that result from wartime spending. Military spending by the federal government totals more than $2.9 trillion since 2001, with the wars in Afghanistan and Iraq comprising over half of that amount and costing the US economy an average of $109 billion per year over that period. Spending for the Afghanistan and Iraq wars created 1.2 million jobs annually, and an additional 1 million jobs were created through other war-related spending, as we see from the first row in Table 2. Yet if the US government had not entered into these conflicts and had instead channeled the same amount of spending toward other areas of national concern, at least 2 to 3 million jobs would have been created annually. Net job creation would have been 1 to 2 million jobs greater if the US had not been at war. Thus wartime spending not only diminishes opportunities for a cleaner environment and a healthier and more educated population, but also decreases the opportunities for unemployed people to find jobs.
Notes:
1. “Operation Noble Eagle” is the name given to military operations related to homeland security in the post-911 era, including air patrols over US cities and military support to federal, state, and local agencies. For more information, see the Air Force Historical Studies Office, “Operation Noble Eagle,” available here.
2. See Neta Crawford’s summary of these and other war-related costs.
Crawford, Neta (2014). “Summary Costs of War Iraq, Afghanistan, and Pakistan FY2001‐2014, Billions of Current Dollars.” Costs of War.
3. Pollin, Robert and Heidi Garrett-Peltier (2011). “The US Employment Effects of Military and Domestic Spending Priorities: 2011 Update.” Political Economy Research Institute.
4. Using USASpending.gov, I conducted a “prime award advanced search” for all awards through the Department of Defense. I sorted the resulting data by placeofperformancecountrycode (the label used to indicate the country in which the contracted work was being performed) and totaled the number of dollars obligated (data label: dollarsobligated) for each year in each place of performance.
5. As of July 2014, the unemployment rate is 6.1% (9.5 million unemployed/155 million in labor force), according to the Current Population Survey (as presented by the US Bureau of Labor Statistics). Reducing unemployment to 7.64 unemployed persons (9.5m-1.83m) results in an unemployment rate of 4.9%.
Join us in defending the truth before it’s too late
The future of independent journalism is uncertain, and the consequences of losing it are too grave to ignore. To ensure Truthout remains safe, strong, and free, we need to raise $46,000 in the next 7 days. Every dollar raised goes directly toward the costs of producing news you can trust.
Please give what you can — because by supporting us with a tax-deductible donation, you’re not just preserving a source of news, you’re helping to safeguard what’s left of our democracy.