America’s emissions are not falling, as suggested by the US Energy Information Administration (EIA). The two main reasons are offshored goods and services and fracked natural gas. The EIA does two things that obscure reality when evaluating emissions. One is that it counts only emissions made in the United States. All those goods and services made in China or other developing nations don’t count against US emissions. The other is the warming potential of other greenhouse gas emissions. The EIA counts only CO2 as a greenhouse gas.
So the EIA’s quote that US emissions are falling that has been spread across the media without regard to science, needs some explaining.1
“The decline in energy-related carbon dioxide emissions occurred while the US economy grew in 2012.” US Energy Information Administration, October 21, 2013.
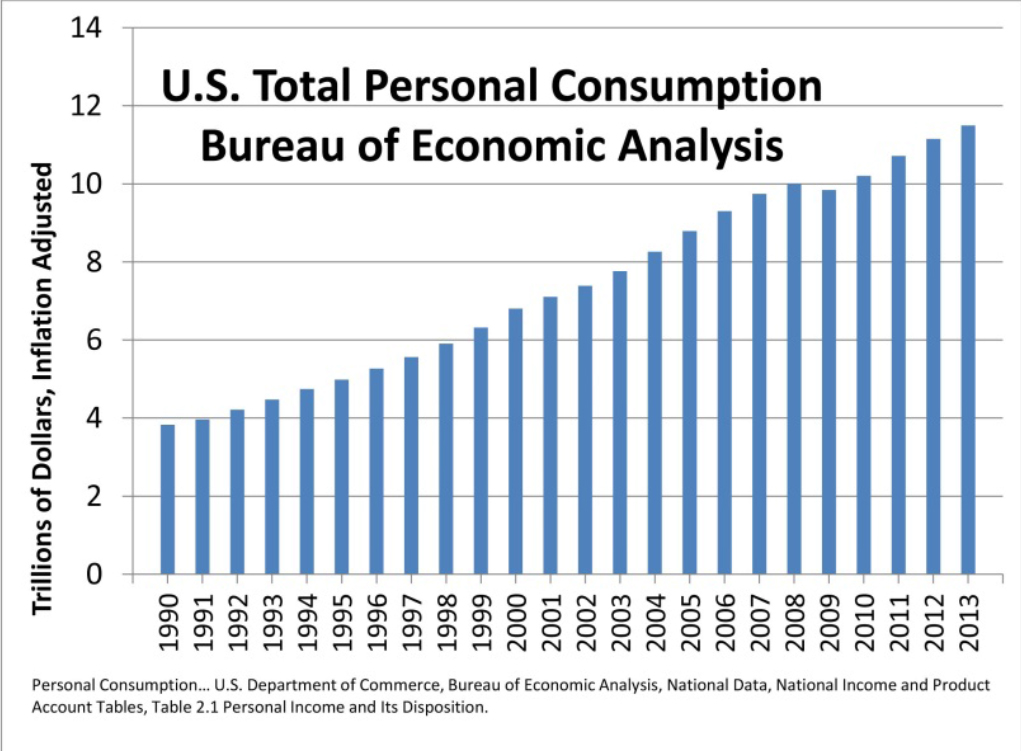
How did our economy grow while emissions fell? Consumption has continued to increase almost without a pause for the Great Recession, according to the Bureau of Economic Analysis.
Other than offshored goods and services, several things have contributed to what appears to be falling emissions. Recent mild winters (pre-2013-14) have reduced electricity and oil demand (production) for residential emissions from electricity to 1998 levels and home heating oil has fallen to pre-1990 levels. Decreasing vehicular travel had reduced transportation emissions to 1998 levels by 2011, and personal driving behavior has continued to decrease.2
But the biggest factor is fracked gas. Cheap natural gas (methane-CH4) from the hydraulic fracturing boom has allowed energy producers to reduce their use of coal – which is now a more costly fuel than natural gas. From the EIA website: “The carbon intensity of the energy supply declined by 1 percent or more in four of the last five years, while in prior years since 2000 it either rose or declined only slightly. Increased use of natural gas for electricity generation in high-efficiency combined cycle plants has contributed to this decline.”3
What they mean by this is that burning natural gas creates only about half of the carbon dioxide as coal – which reduces carbon intensity. In 2007, natural gas generated 29 percent of US electricity; in 2011 this rose to 35 percent. And in 2012, it was 43 percent.4 As more natural gas is burned to produce our nation’s electricity, then less CO2 will be emitted.
But this is just part of the mirage. Increasingly, the US has offshored goods and services production to developing nations. These goods and services are manufactured or created outside of the US, and therefore the greenhouse gas emissions incurred in their production are not accounted for by the EIA in US emissions.
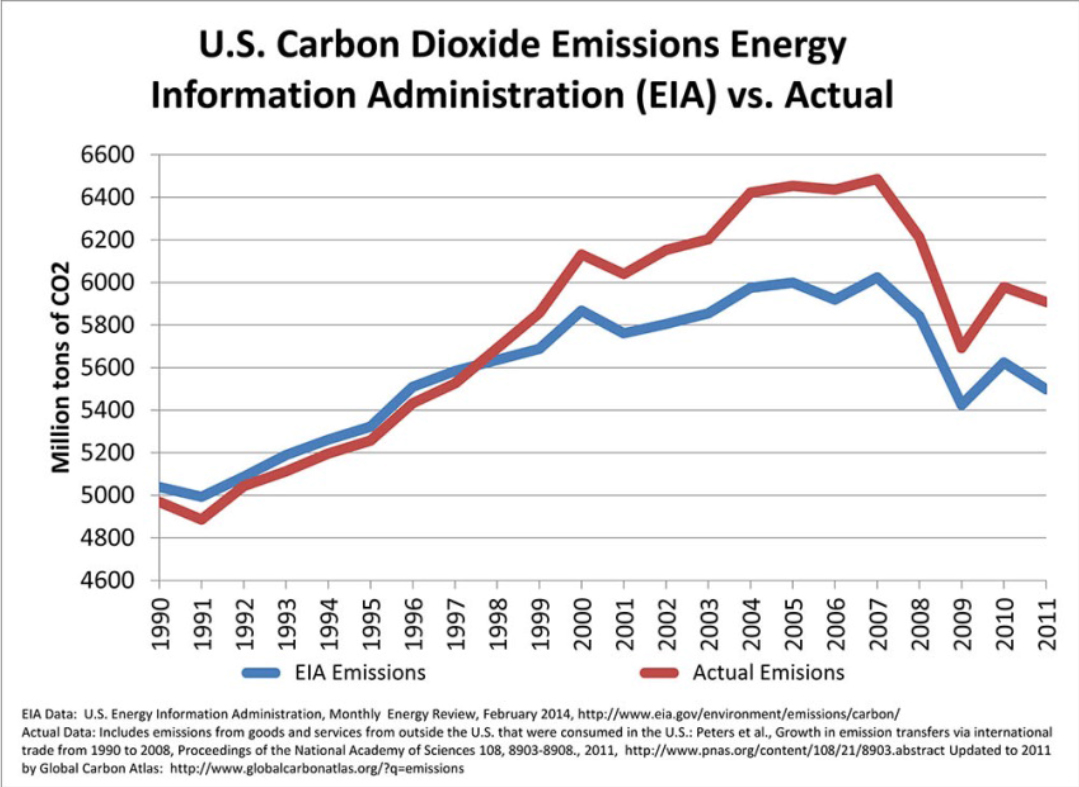
In the graphic above, it is easy to see why the EIA has made the statement that US emissions are falling. The decline of emissions in the two years of the recent recession did see a drop of about 10 percent as shown in the EIA data represented by the blue line. The red line however is actual emissions made by Americans and includes those emissions from goods and services consumed by Americans but created in other countries. Actual emissions, including offshored goods and services, fell too. But in 2011 they had rebounded to almost the same amount as the peak US emissions year from the EIA in 2007 before the recession. And, the increasing trend is important.
Professor Glen Peters at Norway’s National Center for International Climate and Environmental Research (CICERO) at the University of Oslo is one of the world’s leading scientists working on the sources of greenhouse gases in our atmosphere. While refining the details for this article, I asked him what is the most important thing to remember about the evolution of our culture’s emissions behavior, and this is what he had to say:
“The important point to make … the emissions transfer was affected through the financial crisis but is now back to the pre-financial-crisis levels.”
Fracking Emissions Mirage
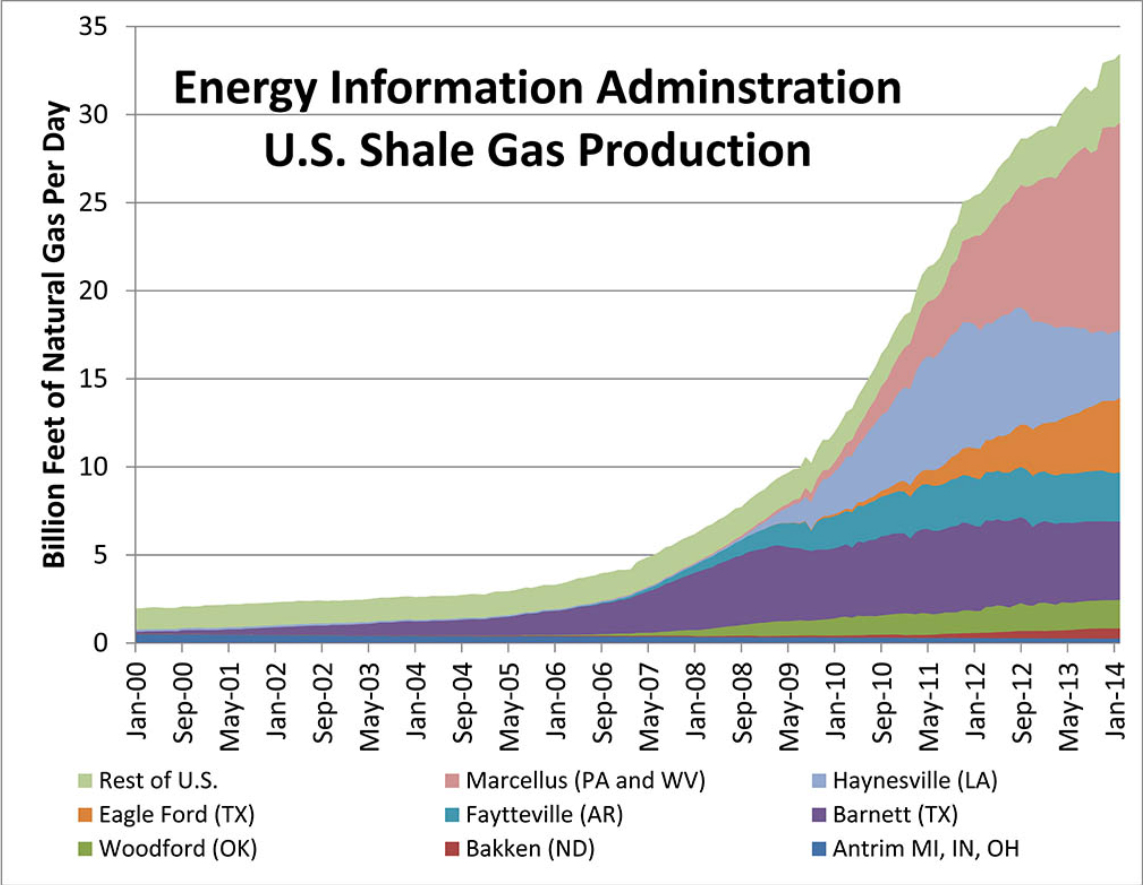
The scale of this emissions mirage is likely even larger than when considering offshoring. In the years since 2011, the enormous boom in fracked gas production has nearly doubled (increased 81 percent). Americans’ consumption has continued to increase, and the global economic recovery continues. All of this increasing production increases emissions. Altogether, the gap between EIA emissions and actual emissions, considering offshored goods and services, likely has only increased.
Taken altogether, even the significant drop in carbon intensity reflected by the increasing use of cheap natural gas has not sated Americans’ thirst for goods and services. But, as is usual in complicated science, this story is far from over.
Swapping Coal for Natural Gas: Good or Bad for Total Greenhouse Gas Emissions?
We very likely will find solutions to carbon dioxide pollution in our atmosphere in the long term. But in the meantime, because we have delayed action on climate change for so long, the risk of abrupt change and climate tipping points is much greater than it was 20 years ago, when mankind first began trying to regulate greenhouse gas emissions.
Twenty years ago, simple emissions reductions were all that were required to control climate change. Today, the 2013 IPCC says there must be “large net removal of CO2 from the atmosphere over a sustained period,” and CO2 emissions must be “strongly negative over a sustained period.” This means that emissions reductions must be significantly more than 100 percent of annual emissions – or we must begin removing some of the accumulated climate pollution that is already in our sky.5
The natural gas fracking process creates a lot more leaked natural gas (methane) than traditionally produced natural gas. Natural gas (methane) is a very strong greenhouse gas that in long-term time frames (100 years) is 33 times more potent than CO2.
The reason that fracked gas creates more leaks (called fugitive emissions) is the up to 16,000 pounds of pressure used to fracture rock that holds natural gas – using on average 2.5 million gallons of water per well.6 After the rock is fractured, the pressure is released, bringing 15 percent to 20 percent of the fracturing water back to the surface through the well casing in what is known as the production process. This water is loaded with natural gas, which mostly escapes to the atmosphere at almost all wells.
In 2011, research out of Cornell says that normally, about 3 percent of natural gas escapes from conventional natural gas wells during production and after production through compressors, valves, pipelines and end uses. But with fracking, this number is up to 7.9 percent – all because of the natural gas contained in the fracturing water during the well production process.7
There is no mechanism or regulatory requirement commonly used to capture these fugitive emissions from all of that fracking water. In 2014 this number – that fracked gas produces twice or more normal fugitive emissions than conventionally produced gas – was reconfirmed by research out of Stanford.8
And to give a better idea of the scale of the challenge, the US Golf Association says that a typical golf course uses 865,000 gallons of water per week for irrigation and the EPA’s household water use rate of about 300 gallons per day equals the water use of over 8,000 homes per day—per each fracked gas well brought into production.9 Since 2005, 82,000 fracked wells have been drilled in the United States.10
Natural gas (methane) is a greenhouse gas much more powerful than CO2, but with a typical life in the atmosphere of only about 12 years versus the life of CO2 at 300 years.11 Because of the accumulating effect of CO2 over time, methane is not as important of a greenhouse gas in long time frames. But in short time frames, it is far more powerful. And because of more than 20 years of delay in addressing climate pollution, the short-term is now far more critical than before.
Recent Research Says Natural Gas Produces Less Warming than Coal?
Based on the long-term 100-year time frame, a couple of recent reports add to the knowledge base that tells us that natural gas is a decent bridge to a climate pollution-free future.12 But these evaluations are basically simple test-tube analyses of individual global warming gases. They neglect chemical reactions in our atmosphere once the gases are released.
About five years ago, we finally began to learn more about how global warming gases react with other gases and other processes in our atmosphere, and what we have discovered is that things are a lot different in the real world.
When short-term time frames are considered, and when chemical reactions and other atmospheric processes are considered, research out of NASA’s Goddard Institute for Space Studies and Columbia University says that natural gas has 105 times the global warming potential of CO2.13
An example of those “other” atmospheric processes comes from research out of NASA, the University of Illinois, Environmental Defense Fund and Berkeley that shows oil is responsible for 2.5 times more warming than coal in the 20-year time frame. Yes, I wrote that correctly, it’s the opposite of what we have known for 30 or more years.
The reason is that burning coal emits far more global cooling sulfates than burning oil (gasoline and etc.)14 Sulfates (sulfur dioxide) are one of the main ingredients of smog, and it is a global cooling pollutant. And natural gas burns even more cleanly than oil and oil products. So it is quite likely that natural gas creates even more than 2.5 times the short-term warming than coal.
It’s the Short-term Climate Time-frame that is Critical – Fracked Natural Gas Warms More than Coal
A study by Tom Wigley and team out of the National Center for Atmospheric Research (NCAR) has looked at natural gas replacing half of coal energy production by 2140 and evaluated all the little details of this swap, which include warming from methane leakage from gas production, coal mining and black carbon; cooling from emissions of global-cooling sulfates; and differences in the efficiency of electricity production between coal- and gas-fired power generation.15
The NCAR study finds: “On balance, these [details] more than offset the reduction in warming due to reduced CO2 emissions. When gas replaces coal there is additional warming out to 2050 with an assumed leakage rate of 0%, and out to 2140 if the leakage rate is as high as 10%. The overall effects on global-mean temperature over the 21st century, however, are small.”
Replacing more than half of coal burning with natural gas would create even more warming in the 2030 to 2040 time frame because of the reductions of global cooling sulfates from burning less coal.
A Few More Unexpected Surprises
Coal exports have increased markedly from the United States, so the greenhouse gases are not staying in the ground, according to www.CO2Scorecard.org and EIA data.16
Work by Alvarez et al., out of the Environmental Defense Fund, Princeton, Rochester and Duke titled “Greater focus needed on methane leakage from natural gas infrastructure,” tells us that natural gas automobile conversion warms more than it cools for the next 80 years and 300 years for diesel-fueled vehicles.17 But Alverez looks at the straight test-tube warming potential only and does not take into consideration those dynamic atmospheric interactions that the Wigley study evaluated.18
Wigley has this to say in the NCAR press release on the findings that evaluate global cooling sulfates and other atmospheric processes:
“Whatever the methane leakage rate, you can’t get away from the additional warming that will occur initially because, by not burning coal, you’re not having the cooling effect of sulfates and other particles. … This particle effect is a double-edged sword because reducing them is a good thing in terms of lessening air pollution and acid rain. But the paradox is when we clean up these particles, it slows down efforts to reduce global warming.”
NOTES
1 Emissions declined while economy grew …
US Energy Related Carbon Dioxide Emissions 2012, US Energy Administration Agency, Environment, Analysis and Projection, October 21. 2013. Second section.
2 Falling residential and transportation emissions …
ibid. Sections 3, 4 and 5.
3 Switching from coal to natural gas …
ibid. Section 8.
4 Natural gas generated 29 percent of US electricity, and in 2011 this rose to 35 percent. And in 2012 it was 43 percent. …
Afsah and Salcito, US Coal Exports Erode All CO2 Savings from Shale Gas, CO2 Scorecard, March 24, 2014, Table 1.
5 IPCC 2013 Greater than 100 Percent Emissions now required…
The IPCC now says that we must remove greater than 100 percent of annual emissions to avoid dangerous climate change. The following quote is from the next-to-last statement of fact in the SPM: “A large fraction of anthropogenic climate change resulting from CO2 emissions is irreversible on a multi-century to millennial time scale, except in the case of a large net removal of CO2 from the atmosphere over a sustained period.” Chapter 12 repeats this statement in different language that adds more meaning and clarification to the Summary for Policymakers statement. From the summary of Chapter 12 (Long-term Climate Change: Projections, Commitments and Irreversibility) we find: “A large fraction of climate change is largely irreversible on human time scales, unless net anthropogenic CO2 emissions were strongly negative over a sustained period.”
IPCC 2013: … large net removal; IPCC 2013, Summary for Policy Makers, E.8 “Climate Stabilization, Climate Change Commitment and Irreversibility,” p 20, fourth bullet.
IPCC 2013: … strongly negative; IPCC 2013, Chapter 12, Long-term Climate Change Projections, Commitments and Irreversibility, Executive summary, Page 1033, sixth paragraph.
6 2.5 million gallons per well average across the nation …
Freyman, Hyraulic Fracturing and Water Stress. Water Demand by the numbers, Ceres, 2014, page 19, box – Water Use Trends.
7 Up to 7.9 percent of natural gas escapes during the life of a fracked natural gas well. … Howarth et al., Methane and the greenhouse gas footprint of natural gas from shale formations, Climatic Change, 106, 4, 2011, abstract, first sentence.
8 Up to 7.1 percent of fracked gas escapes … “This excess is conservatively defined as 1.25 to 1.75 times EPA GHGI estimates.”
Brandt et al., methane leaks from North American natural gas systems, Science, February 14, 2014, page 735, first paragraph.
Conflicting Research … Other research has shown fugitive emissions from fracking to be significantly less. One of these recently had a correction published that states:
The authors note that upon publication their conflict of interest statement was not complete. The updated disclosure statement is as follows, “Jennifer Miskimins holds a joint appointment with Barree & Associates and the Colorado School of Mines. She has also served as an advisor to Nexen in 2012. David T. Allen served as a consultant for the Eastern Research Group and ExxonMobil in 2012, and is the current chair of the Science Advisory Board for the EPA. John H. Seinfeld has served as a consultant for Shell in 2012. David T. Allen, Matthew Harrison, Charles E. Kolb, and Robert F. Sawyer variously serve as members of scientific advisory panels for projects supported by Environmental Defense Fund and companies involved in the natural gas supply chain. These projects are led at Colorado State University (on natural gas gathering and processing), Washington State University (on local distribution of natural gas), and the University of West Virginia (on CNG fueling and use in heavy duty vehicles).”
Allen et al., Measurements of methane emissions at natural gas production sites in the United States, Proceedings of the National Academy of Sciences, October 29, 2013.
9 865,000 gallons per week irrigation for a golf course and the water use of more than 8,000 homes in one day…
Lyman, Golf’s Use of Water, Solutions for a more sustainable game, United States Golf Association, 2012.
EPA water use of about 300 gallons per household per day: Environmental Protection Agency, Water Sense, Water Use Today, third paragraph.
10 82,000 fracked wells since 2005 … Ridlington and Rumpler, Fracking by the Numbers, Environment America, October 2013, page 4, table ES-1.
11 Atmospheric life of CO2 and Methane … Carbon dioxide stays in our sky for 300 years. … “In fairness, if the fate of anthropogenic carbon must be boiled down into a single number for popular discussion, then 300 years is a sensible number to choose, because it captures the behavior of the majority of the carbon. … However, the 300 year simplification misses the immense longevity [10,000 years] of the tail on the CO2 lifetime, and hence its interaction with major ice sheets, ocean methane clathrate deposits, and future glacial/interglacial cycles. … A better approximation of the lifetime of fossil fuel CO2 for public discussion might be 300 years, plus 25% that lasts forever.”
Archer, Fate of fossil fuel CO2 in geologic time, Journal of Geophysical Research, vol. 110, 2005, page 5 of 6, Summary, final Paragraph.
Life of Methane … 12 years, IPCC Third Assessment Report, Scientific Basis, C1, Table 1.
12 Based on the 100-year warming potential of natural gas (methane) and neglecting other dynamic warming cooling process in our atmosphere, a couple of recent reports indicate; yes, natural gas remains a decent bridge to a climate pollution-free future …
Brandt et al., Methane leaks from North American natural gas systems, Science, February 14, 2014.
Fulton et al., Comparing Life-Cycle Greenhouse Gas Emissions from Natural Gas and Coal, WorldWatch Institite, August 25, 2011. Appendix B. page 28.
13 Methane 33 times more potent than CO2, 105 times more potent in the short term. …
Shindell, et. al., Improved Attribution of Climate Forcing to Emissions, Nature, October 2009.
14 Oil (Transportation sector) is responsible or 2.5 times more warming than coal (energy sector) in the 20-year time frame. … Unger et al., Attribution of climate forcing to economic sectors, PNAS, December 2009, page 3384, Figure 1: On-road (transportation) radiative forcing (global warming) of 199 Watts per meter vs. Power (coal) 79 watts per meter = 2.52 times more warming.
15 With zero leakage, when natural gas replaces coal there is additional warming out to 2050. … Wigley, Coal to gas: the influence of methane leakage, Climatic Change Letters, August 26, 2011, abstract, final sentence.
16 Coal Exports have increased even faster than before the recession. …
17 Natural gas vehicle conversion warms more than cools …
Alvarez et al., Greater focus needed on methane leakage from natural gas, PNAS, April 24, 2012, page 3436, paragraph eight.
18 Alvarez does not look at dynamic atmospheric warming/cooling effects other than CO2 and CH4 (methane)…
Alvarez et al., Greater focus needed on methane leakage from natural gas, PNAS, April 24, 2012, page 3436, paragraph ten.
Join us in defending the truth before it’s too late
The future of independent journalism is uncertain, and the consequences of losing it are too grave to ignore. To ensure Truthout remains safe, strong, and free, we need to raise $33,000 in the next 2 days. Every dollar raised goes directly toward the costs of producing news you can trust.
Please give what you can — because by supporting us with a tax-deductible donation, you’re not just preserving a source of news, you’re helping to safeguard what’s left of our democracy.