Beginning in just eight years, we could see permanent climate conditions across the North American Southwest that are comparable to the worst megadrought in 1,000 years. (1)
The latest research from the Lamont-Doherty Earth Observatory at Columbia University published in December 2012 has some truly astounding news. The megadroughts referred to in the paper published in Nature Climate Change happened around about 900 to 1300 AD and are so extreme that they have no modern counterpart for comparison (these megadroughts will be referred to in the following as the “12th century megadrought”). The research was funded by the National Oceanic and Atmospheric Administration (NOAA).
We have been warned for decades that we would be facing a megadrought if we did not do something about climate pollution. We did not, and now according to the projections of a new study, that is just what the future may hold. And remember, projected conditions similar to the worst megadrought in 1,000 years would be the baseline conditions. Dry periods, which we normally refer to as drought times today, would be superimposed on top of the megadrought extremeness.
The Lamont-Doherty research not only includes one of the four new climate scenarios, but also uses the new high-resolution climate models that provide more detail and accuracy. Both will be found in the forthcoming 2013 Intergovernmental Panel on Climate Change report (IPCC 2013). The authors tell us about the new climate scenario:
The RCP85 scenario involves stronger anthropogenic radiative forcing [than the old IPCC scenario] and was chosen to reflect the present lack of any international action to limit CO2 emissions.
Let me interpret. “RCP85” is one of four new scenarios the IPCC has requested the research community to prepare. The four scenarios were chosen from existing international research literature in 2007 at a meeting in the Netherlands consisting of 130 international stakeholders.
The old scenarios (40 of them) were based on a complex “storyline” involving the way our global society changed over time, what type of and how much energy we used, when and how fast we changed our land from forest to fields, how quickly population grew or did not grow, and different population growth rates in different regions. The new scenarios represent the concentrations of greenhouse gas pollutants in the atmosphere and the amount of warming they create instead of the vastly varying emissions of the old scenario storylines. (The “RCP” in the scenario’s name means Representative Concentration Pathways.) The new scenarios do not represent any one future snapshot of the way our society evolves. Different evolutionary paths could result in the same greenhouse gas concentrations. The new scenarios are the simple end result of greenhouse gases emitted to our atmosphere by any number of societal evolution pathways. It’s a simpler process, and it updates the old scenarios prepared in 2000 with current greenhouse gas data. It also reflects a revelation in research that because we have failed to act on climate change, the old worst-case scenario was optimistically good. (2)
The new models have more grid squares (higher resolution) in that they can “see” a smaller piece of the earth compared to the old models. The old models took forever to run on supercomputers, and so do the new ones, but we can see smaller areas and smaller scale climate processes are better represented now. The new models also include volcanoes, changes in the sun’s strength and more complex interactions between clouds and pollutants like nitrous oxides and sulfur dioxides (both manmade and natural), and their results agree better with observations of our past climate.(3)
The results of the new scenarios and most current modeling (as compared to the old scenarios and models) are that warming is greater, drying in dry areas is greater and increasing wetness in wet areas increases further. (4)
And just to finish up translating that quote, as I have been doing for four paragraphs now, let’s take “Anthropogenic radiative forcing.” “Anthropogenic” is human-made; and “radiative forcing” refers to the stronger-than-normal greenhouse warming we will experience because of climate pollution. Of equal importance in the quote is the acknowledgement, in a peer-reviewed research publication, that there has been a lack of action in the international community on reducing CO2. This type of statement is something we are seeing more of these warming days.
The results of the new research are critically deserving of an alarmist tone. That we could slip into profound continuous drought so soon is certainly a surprise to most of us, to say the least. The typical consensus opinion of unrestrained climate pollution impacts by the year 2100 only tells us that permanent drought will come to many parts of the world and, basically, that dry areas could become drier. The news that we could be experiencing permanent drought on the scale of megadrought proportions – beginning in only eight years – should be considered a global threat of the highest order.
So why, once again, is there no alarm? The prepublication press release for this paper came out on December 23 and while it did get picked up by a few sources, the only major outlet was Agence France Press. All of the coverage referenced the 10 percent reduction in streamflow that this work’s modeling projects for the near future. This seemingly small number appears to have limited journalists’ interest in the results of the research as a whole. No one who wrote about the paper seems to have recognized the megadrought reference.
Implications for increased evaporation and the seasonality of the projected drying, both of which the authors say were important, were only regurgitated from the press release with little additional thought. It is the megadrought reference, however, that gives us a true understanding of exactly how worried we should be.
The NOAA Climate Variability and Predictability Program’s press release at Columbia University gives us an authoritative view of this research:
Long tree ring records allow estimations of past variations in Colorado River flow and suggest a 15% reduction of flow during the 12th Century megadrought. Therefore the new paper concludes …
Anthropogenic climate change is projected to lead to a potential reduction of Colorado River flow comparable to the most severe, but temporary, long-term decreases in flow recorded. (5)
This “most severe, but temporary, long-term decrease in flow recorded” is the concept we need to understand. This is the megadrought reference. A 10 percent reduction beginning 2021 to 2040 is extreme enough for these researchers to compare the average conditions projected for the very near future to the 12th Century megadrought. This single message is critical and it was missed by popular reporting. Just to be sure I am clear: this quote “temporary, but long-term decreases in flow” here refers to these 75- to 200 year-long megadroughts, the last one occurring about 1,000 years ago or in the 12th Century. These droughts were temporary, like the droughts of today, but in the near future, conditions comparable to these droughts will be the average climate condition. Dry periods that we know as drought today will be on top of megadrought dryness.
In 2004, Edward Cook and a team of researchers published a paper in Science that describes this 12th century megadrought. These researchers were from Lamont-Doherty, as well as NOAA, the National Climatic Data Center and the Universities of Arizona and Arkansas.
The 12th century megadrought was a part of a series across western North America over a 400 year period. According to the authors, it “dwarfs” the ongoing western drought we are currently experiencing. (6) This ongoing western drought also differs in a surprising way from the Dust Bowl, as we can begin to see in the graphic below and as I will explain further:
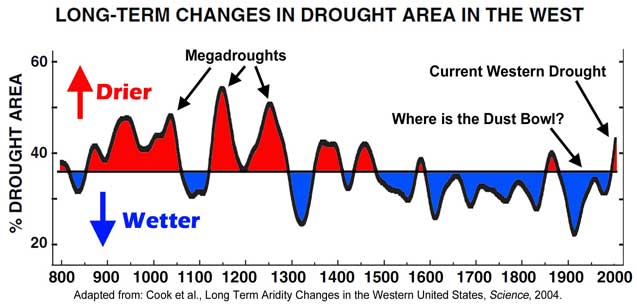 Current western drought pales in comparison to prehistoric megadrought. Conspicuously absent from this record is the Dust Bowl. This data was averaged using a 60-year period. This “averaging” smooths out the record of the Dust Bowl because it was short and situated more in the Great Plain instead of across the entire U.S. West.
This work by Cook and colleagues was compiled from tree rings found in some really odd places, like ancient Anasazi cliff-dwelling timbers and tree stumps beneath the waters of lakes in the Great Basin that were alive during the megadroughts and were subsequently submerged as the lakes rose afterwards. Clues were also found in sediment deposits in North Dakota, evidence of drifting sands in Nebraska and lichen residue in Texas. These megadroughts were powerful enough to lower the level of the lakes in the Great Basin (including Great Salt Lake) by 200 feet and change parts of the Great Plains into a sea of shifting sand.
What the above graph shows us is the great difference between the megadroughts and our current western drought. The century scale length of the megadrought periods is profound relative to drought our society has experienced. Even more striking is the relationship between the current western drought and the Dust Bowl. In the graph above, the Dust Bowl does not appear to be represented and there are a couple of reasons for this.
The Dust Bowl was a little more centered in the Plains. Cook looked at all of the United States west of the Mississippi River. But more importantly, the graphic above uses a 60-year smoothing. What this means is that the graphic shows us the 60-year average of drought conditions. Because the Dust Bowl lasted only about 10 years, its extremeness is diminished in the averaging process for the smoothing. To see the relationship between the Dust Bowl and the current western drought more easily, see the graphic below, which does not include 60-year smoothing:
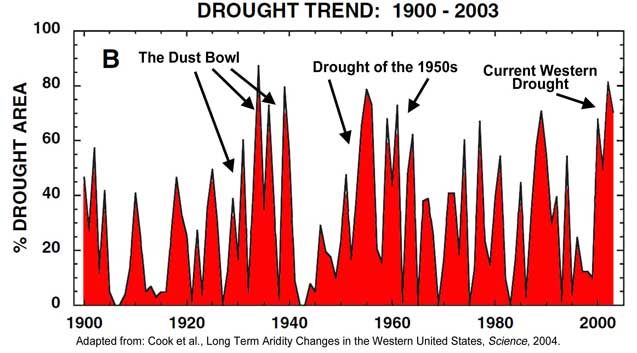 This image shows the details of drought area across the western U.S. without averaging. The authors tell us the following about the current Western Drought, “Its 4-year duration appears to be unusual over the past 104 years.”
The current western drought, though it has not yet lasted as long as the Dust Bowl and its worst peak has not been quite as high, shows more continuous red uninterrupted by wet years. This continuous stress is much worse on an ecosystem than an extreme drought punctuated with a year or two of wetness here and there, like we saw in the Dust Bowl. Cook and his team also observed that the four-year duration of the current drought “appears to be unusual over the past 104 years.” This “four-year duration” is based on their data, which ended in 2003. The drought did ease somewhat in 2005 and then again in 2009 and 2010, according to archived maps found on National Drought Mitigation Center’s Drought Monitor. Otherwise, it has been in existence across large parts of most of the American West since Cook’s work was published in 2003. (7)
The Dust Bowl was also a singular event strongly enhanced by agricultural practices. A series of wet years in the early 20th century lulled us into thinking that the Great Plains region was an agricultural nirvana. Sodbusters arrived by the tens of thousands and ripped the moisture-sustaining prairie grasses from the land with little thought to long-term consequences. When dry times returned, little of the natural prairie grasses remained to conserve moisture. This led to more evaporation than normal – aggravating the drought. With the increased dryness came increased winds, themselves induced by the drought. The winds made evaporation even higher; the Dust Bowl ensued and sands began to move.
Today, modern agricultural practices diminish the wholesale drying experienced during the Dust Bowl, but extreme drought persists in the West. This is because the average temperature in the West has warmed at nearly twice the global average according to the Rocky Mountain Climate Change Organization. (8)
There are a few more things I need to mention to drive home the significance of the 10 percent reduction in stream flows. One is timing. The modeling shows that spring, summer and fall see a greater reduction in flows in most places than in winter. In many places, more mountain precipitation is now falling as rain in the winter, and this will increase. More runoff in winter means less snowpack, less water slowly percolating down into the aquifers, lower aquifer levels and a longer evaporation season as the snowpack disappears early. (9)
Compounding the increased length of the evaporation season, a little more warmth means a lot more evaporation. It is not a one-to-one relationship. The impacts are compounded in one more way. In the high country where most of the West gets its water, a little warming, and its corresponding evaporation, takes water that should slowly melt and feed aquifers or run off into reservoirs and evaporates it directly into the sky.
Another confusing aspect of this work is that numerous places in the press releases, and in the findings themselves, tell us and show us in graphic form that not all seasons in all areas experience drying and increased evaporation. The Columbia University press release tells us that, “The Colorado headwaters are expected to see more precipitation on average,” and the NOAA Climate Variability and Predictability Program press release at Columbia tells us that, “Despite the fact that precipitation might increase in some regions and seasons (e.g. winter in northern California).” The most telling example of this climate confusion comes at the bottom of the Columbia University press release. This statement by Mingfang Ting, one of the paper’s authors and a specialist in precipitation extremes, tells us: “For Texas, the models predict that precipitation will decrease and evaporation rates will also go down in spring and summer, but only because “there is no moisture to evaporate.” (10)
Climate scientists have been pulling this alarm for 20 years. It is real – the building is on fire. To pull the fourth alarm on this one: Truthout wrote Professor Seager and asked him to confirm the assumption that natural drought cycles would add to or be on top of the projected megadrought drying. He confirmed, adding, “For the next one to three decades, results are not greatly different across the [different scenarios] because so much of what will happen is already in the pipeline, so to speak.”
What does this mean? It means that even the best-case scenario that the IPCC is now considering results in an outcome that is the same, or “not greatly different,” from the worst-case scenario of the new IPCC scenario family, for the next 10 to 30 years.
Things will get far worse if we do not do something about climate pollution as fast as we can. But there is good news. Reality tells us that, contrary to what the voices of denial and delay are saying, the solutions to climate pollution will be no more expensive than the cost of clean drinking water across the planet every day. (11)
References:
1.
Permanent climate conditions across the North American Southwest that are comparable to the worst megadrought in 1,000 years … Seager et al., Projections of declining surface water availability for the southwestern United States, Nature Climate Change, December 2012, page 5, last paragraph.
Abstract: https://www.nature.com/nclimate/journal/vaop/ncurrent/full/nclimate1787.html
NOAA: https://www.ldeo.columbia.edu/res/div/ocp/glodech/research11%20SW%20water%20surface.html
Earth Institute press release: https://blogs.ei.columbia.edu/2012/12/23/smaller-colorado-river-projected-for-coming-decades-study-says/
2.
Scenarios: Old scenarios (SRES) are emissions based… IPCC Special report on Emissions Scenarios, see Foreword.
New Scenarios (RCP) are based on radiative forcing, or warming caused by greenhouse gases… Intergovernmental Panel On Climate Change, Representative Concentration Pathways (RCPs), first paragraph.
Creation of New Scenarios… Moss et al., Towards New Scenarios for Analysis of Emissions, Climate Change, Impacts, and Response Strategies, Intergovernmental Panel on Climate Change, Geneva, 132 pp, 2008, first paragraph, page i. https://www.aimes.ucar.edu/docs/IPCC.meetingreport.final.pdf
3.
New Climate Models… Knutti and Sadlacek, Robustness and uncertainties in the new CMIP5 climate model projections, Nature Climate Change, October 28, 2012, last paragraph, left column, page 1.
Old models, future CO2 concentration… United Nations Environmental Program, GRID ARENDAL, Past and Future CO2 Concentrations. (accessed 021313)
4.
The results are that warming is greater, drying in dry areas is greater and increasing wetness in wet areas increases further… Knutti and Sadlacek, Robustness and uncertainties in the new CMIP5 climate model projections, Nature Climate Change, October 28, 2012. This statement is reflected in Figures 1, 2 and 3 on pages 2 and 3.
5.
Long tree ring records allow estimations of past variations in Colorado River flow … comparable to the most severe, but temporary, long-term decreases in flow recorded … NOAA Discussion of the paper, last two paragraphs, accessed January 30, 2013.
6.
Dwarfs the current western drought … Cook et al., Long Term Aridity Changes in the Western United States, Science, November 2004, page 1017, top of page right column.
Abstract: https://www.sciencemag.org/content/306/5698/1015.short
Full paper: https://tiggernut.com/ClimateChange/CookLongTermAridity.pdf
7.
Unusual in the last 104 years … Ibid. page 1017, second paragraph, right column. Drought conditions since 2004: North American Drought Monitor.
8.
The Rockies have seen nearly twice the average global warming… Hotter and Drier: The West’s Changed Climate, Rocky Mountain Climate Organization, February, 2008, page iv. The American West experienced 70 percent more warming than the average for the rest of the world.
9.
More mountain precipitation is falling as rain in the winter … Ibid., page v.
10.
There is no moisture to evaporate… State of the Planet, Water Matters, Smaller Colorado River Projected for Coming Decades, Study Says, sixth paragraph, accessed on January 31, 2013.
The Colorado headwaters are expected to see more precipitation on average… Columbia University Press Release, Sixth paragraph.
Despite the fact that precipitation might increase in some regions and seasons (e.g. winter in northern California)… NOAA Climate Variability and Predictability Program press release, forth paragraph.
11.
The solutions to climate pollution will cost 1 percent of global GDP per year … The annual cost, for about the last 100 years – every year – for providing our global society with clean drinking water has been about 1 percent of global GDP annually, at $500 billion. Alley, Richard. Earth: The Operators’ Manual, WW Norton, 2011.
Other things that cost one about $500 billion per year:
-Annual US military budget has averaged $500 billion since about 1980, not counting wars.
–Advertising at $500 billion per year globally. $492 billion in 2011. Forecast to $629 by 2015.
-Agriculture damages from normal weather at $500 billion per year in the US alone. In the US alone we see $485 billion normal weather damages to agriculture every year. Lazo et al., US economic sensitivity to weather events, American Meteorological Society, June 2011. Press release.
–US health care costs in 2009 were five times the cost of global clean drinking water at $2.5 trillion per year.
Join us in defending the truth before it’s too late
The future of independent journalism is uncertain, and the consequences of losing it are too grave to ignore. We have hours left to raise the $12,0000 still needed to ensure Truthout remains safe, strong, and free. Every dollar raised goes directly toward the costs of producing news you can trust.
Please give what you can — because by supporting us with a tax-deductible donation, you’re not just preserving a source of news, you’re helping to safeguard what’s left of our democracy.